Image Analysis
About
Manual nuclei counting or measuring the area covered by foci with programs like ImageJ can be incredibly tedious and time consuming. Fully definable high content analysis software removes this bottleneck allow for bespoke protocols to be written that will give you phenotypic data on a per object (foci, nuclei, cell), per field and per well bases. Once written the protocol can be set to run and report back the data with a simple excel file.
Key Features
All software allows for flexible and user definable assay development and can be used with both facility and external generated images. Analysis is performed on dedicated workstation and is unbiased.
Licences for:
- Developer ToolBox (GE)
- INCarta (Cytiva) (plus VoluMetrics 3D analysis
- MetaXpress (MolDev) with Custom Editor Module for 3D analysis
- HALO for Multiplex analysis including Tissue Classifier, TMA-Add on, Hyperplex and Spatial Analysis (Powered by dedicated Cluster analysis servers)
Image analysis
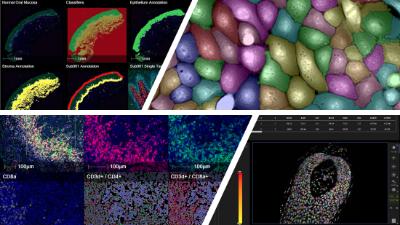
Key Features – HALO (Indica)
HALO is our digital pathology software for high-resolution, multiplexed imaging. It enables quantitative analysis at both the cell and tissue level, supporting spatial biology, advanced biomarker profiling, and publication-ready visualizations. HALO makes it easy to extract, visualise, and export data from complex tissue images for downstream analysis.
-
Whole-slide image analysis
Scalable analysis of large, high-resolution whole-slide images with efficient handling of multiplex images -
Cell-level and tissue-level quantification
Extraction of biomarker intensity, localisation, and morphological features at single-cell resolution. -
Advanced multiplex analysis
Support for highly multiplexed immunofluorescence images using modules such as HiPlex FL, enabling simultaneous analysis of dozens of markers. -
Spatial biology and analysis
Quantification of nearest neighbour distances, infiltration, and spatial relationships within tissues. -
High-quality visualisation and reporting
Generation of publication-ready figures and quantitative outputs suitable for downstream statistical analysis. -
Seamless data export
Easy export of per-cell and per-region data for downstream analysis in R, Python, or other bioinformatics pipelines.
Key Features – INCarta (MolDev)
INCarta (MolDev) is our high-content image analysis platform designed to process complex datasets from slides and multiwell plates. It automates the extraction of detailed cellular and subcellular features, allowing you to generate quantitative, reproducible data for both routine and advanced analyses.
-
Automated high-content image analysis
Streamlines the processing of images from slides and multiwell plates, reducing manual effort while maintaining accuracy. -
Single-cell and subcellular quantification
Extracts detailed features such as marker intensity, organelle-specific signals, and morphological measurements. -
Flexible analysis pipelines
Customisable workflows to match your experimental setup, from simple readouts to complex, multi-parametric analyses. - Batch and multi-experiment handling
Efficiently processes large-scale screens and multiple experimental conditions with consistent, reproducible results. -
Machine learning integration
Supports phenotypic profiling, classification, and predictive modeling to extract deeper insights from high-content datasets.
Developer (MolDev)
Developer is our older software but provides flexible high-content image analysis, ideal for bespoke or challenging readouts. It can handle complex images from slides or multiwell plates, extract single-cell and subcellular features, and provide data for custom downstream analysis.
-
Can allow tailored piplines for unusual or complex assays
-
Supports quantitative measurements of cells and organelles
-
Outputs data ready for further statistical or bioinformatics analysis
About
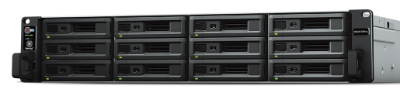
Data storage is often an afterthought when applying for grants and planning a screen. High throughput instruments can take an incredible number of high quality images very quickly. Combine this with 3D imaging, time series, large scale screen and now multiplex projects and you will generate several TBs of data. Within the screening facility we have access to a dedicated research facility data store.
Key Features
- Up to 100TB of available storage
- Images saved directly to core facility storage to stop any bottleneck in image acquisition
- 10Gb network speeds for the most demanding of equipment
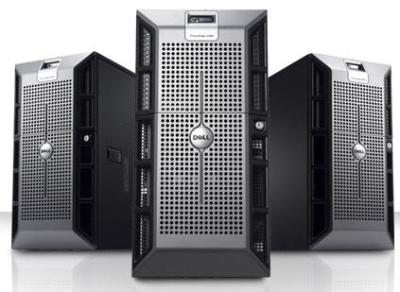
- Networked servers allowing immediate access to files from analysis machines
- Nightly backup to secondary site for disaster proofing of your precious data
- Access to shared data via Globus